1:43 PM Computerized Flood Modeling. | |
After having read some 613 pages of council minutes from the meeting of 26 September 2017, I was faced with the problem of what to do. After reading the section in the minutes regarding the flood overlays, you get a good idea of how this 'computerized flood modelling' works. I won't pretend to be an expert but I thought it may be helpful to put into concise and readable form what I learned. It appears that the software they used was the SOBEK software package from a company called Deltares (See minutes for 26/09/2017 p212.) So how do you make a computer simulation of a flood so that you can predict where flood water will flow and the water depths you will get? As with all things done on a computer, you need to reduce the problem to mathematics. I will not go into any mathematics here. In fact the mathematics was not explained in the council minutes. But I will try to explain the principles involved. Finally, we will look at some of the short comings of these computer flood models. First of all, to reduce a complex problem to mathematics you find yourself doing at least these two things: you tend to make assumptions and; you and you tend to simplify the problem. So how do the flood models work?
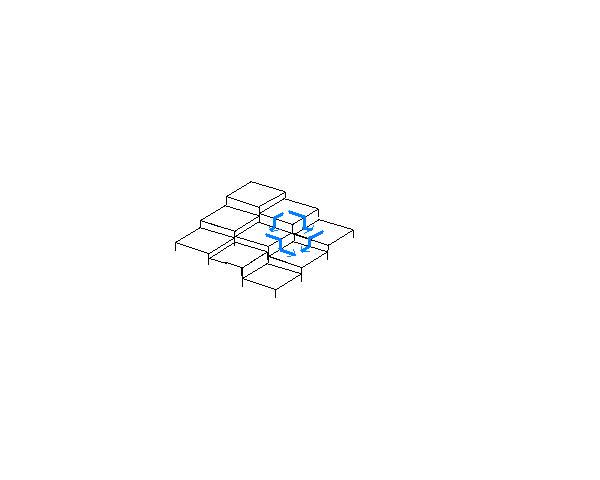
Topography. Topography is the shape or lay of the land. Somehow you need to reflect all the hills, valleys, gullies and so on, inside the computer. The way this is done is by dividing the land up into squares. These squares can be 5 by 5 meters or can be as small as 3 by 3 meters. In the real world, as you look at the landscape around you, you see smooth rolling hills. But that is not how the landscape is represented inside the computer. Inside the computer it is as though you had built the landscape from small, thin Lego tiles. Inside the computer the landscape is seen as a terraced or stepped structure with each square tile at a different elevation.
(My rather amateurish drawing of the tessellated landscape as modeled inside the computer. The blue arrows is the water runoff to lower tiles.) So we reduce the real world to this strange 'digital' landscape that appears to be made up square tiles. Each tile is at a different elevation representing the height of that piece of the landscape. If you were to stand far enough away from this digital creation and squint, it would appear to represent the real world of hills and valleys, etc. First of all, how do we know the elevation or height of each square tile of land? That is where LiDAR comes in. (Minutes p212) LiDAR is really a laser beam mounted in an aircraft. When the aircraft flies over the land, it shoots down beams of light that are reflected back to the aeroplane. The LiDAR device on the aircraft can calculate the distance between itself and the point of reflection, I presume this is done by the very small amount of time it takes for light to travel that distance. What LiDAR is able to do is have the laser rapidly flicker over a large area below the aircraft. What you end up with is a 'cloud' of points scattered below the aircraft. If the elevation of the aircraft is known, then the elevation of each point can be calculated. What we end up with is a very detailed map of the ground under the aircraft. This LiDAR data is then used the set the elevation of each of the square tiles of land in the computer model.
How Does the Flood Model Work? Those of us who studied computer science (for me, that was decades ago) know that these simulations calculate the 'state' of your model at a point in time. Then the time moves forward by a certain amount, and the state of the model is recalculated. That is a bit hard to grasp, so let me explain what it means. Because we are modelling a severe flash flood that might be over in 30 or 45 minutes, we may want to recalculate what is happening every 5 seconds.
The Flood Starts. So at time zero the rain start to bucket down. In the first 5 seconds there may not be much run off so the calculation is rather simple. Starting at the highest tile, we calculate how much rain lands on it in the first 5 seconds. This will give us a water depth that builds up on this tile in the first 5 seconds. For example, this could be 2mm of water on the tile. Then we proceed down to each of the lower tiles, one tile at a time. For each tile we also calculate how much rain lands on it. Inside the computer we keep a record of the calculated depth of water on each tile. When all this is finished and we have calculated the 'state' of the model. That is, we know the water depth on every tile. Next we move time on by 5 seconds.
Water Run Off Starts. In the next 5 seconds, something new starts to happen. Not only does the rain continue to fall but we start to get water run off. Water flows from higher tiles to the lower tiles in our model. Our calculations starts to get more complicated. We again start with the highest tile and calculate how much additional rain water lands on the tile in the next 5 seconds. We add this additional water to the existing water level for the tile and calculate a new depth. But we also get run off. We consider all the tiles around us and take into account their height below the current tile (i.e. the slope toward the lower tile). The slope to each of the surrounding lower tiles is calculated using the difference in elevation. Using some algorithm (i.e. Mathematical formula) we then approximate (guess) how much water will run off onto each of the lower tiles based on the slope toward each of those lower tiles. Lower tiles with greater slopes will get more of the run off. So again it is all done using mathematics. In the computer model we subtract some water from our tile and add it to the lower surrounding tiles. The depth on the higher tiles goes down and the depth of water on the lower tile increases. Again in the computer model we keep a record of the depth of water on each tile. We do the same calculation for each surrounding tile and record the change in depths on each tile.
Handling Drains. Some tiles may have a drain opening and some of the water on the tile will flow down the drain. In the computer model, we subtract some water from the tile and add it to the water in the drain. We repeat these calculations for all tiles on our digital landscape. We take into account the additional rain, the run off onto lower tiles and the run off into drains. As before, when this is finished and the calculations are done for each tile, the 'state' of the model has been calculated. But lets look a bit more closely at drains. We know that drains have a fixed capacity, that is, they can take away a certain volume of water per minute. Our model keeps adding water to the drains. A drain will start with zero water in it and over time we will add water at each drain opening. Maximum drain capacities might be measured in liters per minute. Since we add a known amount of water to a drain each 5 seconds, we can tell when a drain reaches it's maximum capacity. At some point we will try to add water to the drain but the drain will be at maximum capacity. At this point no more water will flow into the drain opening. Instead it will flow overland onto lower tiles adding to the water depth on those tiles. Also further down the hill we might have water flowing up out of the drain and adding to the water on the tiles. This would happen if the drain is at maximum capacity up the slope. Since we know things like the elevation of drain openings (i.e. We know the tile elevation) and we know when a drain reaches maximum capacity and at what elevation it reached maximum capacity, we can figure out when drain water will come up out of the drains further down the slope.
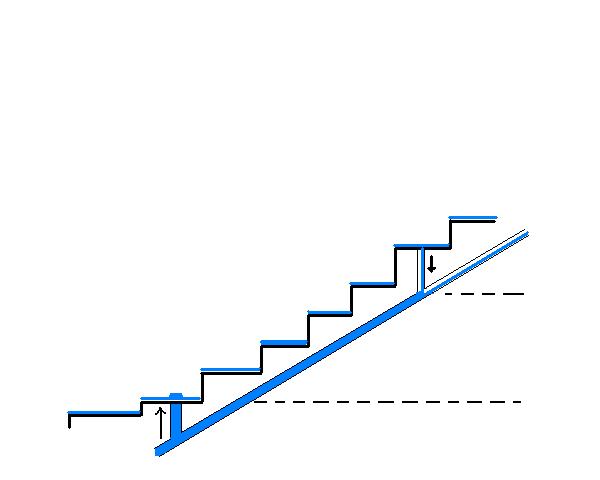
(Another amateurish drawing of a drain that reached maximum capacity further up the hill. Water will come out of the drain at a lower point. The horizontal dotted lines show the 'head' [or pressure] of water that would drive water out of the drain further down the hill.) Simply put, if a drain is at maximum capacity at a higher elevation than drain openings further down the hill, then water will come out the the drains further down the hill. With a bit of experience and some mathematics we could create an algorithm that will approximate how much water rises up out of drains.
Making a Movie out of the Calculations. The computer simulation is a bit like the old cine movies. These old movies are made up of still pictures strung one after the other on a reel of film. When we play them before us quickly we get the impression of motion. It is the same for the computer simulation. We calculate a complete snapshot of the computer flood model each 5 seconds and so we know the depth of water on each tile at that point in time. Then we move on to the next 5 seconds and repeat all the calculations for all the tiles. And we do this again and again, until the downpour stops and the water drains away. When we run these snapshots of the model past us quickly we can see the water level build up at various points in the landscape and water flow down hills and into drains.
Water Speed. There are other things we can calculate using the model. Because we can roughly calculate the slope of the land, we can calculate (roughly) the speed of the water as it runs down the slope. This is is important because if the slope is great, water will flow quickly. It may not just flow onto the next lower tile in the model but it might also flow onto the next tile beyond that. So depending on the slope we may subtract water from our current tile and add it to both the tile below and to the next tile further on.
There are many problems with Computer Simulations like this. As you can see this is a strange digital world where real world events are represented as numbers. There are off course problems with this. There are problems with the data you feed into the calculations and there are problems with the model itself.
Just How Big is a Flood? There can be problems with the data that is fed into the model. For example there might be assumptions made concerning very basic data. Just how heavy is the rain in a 1 in 100 year flood event? The council uses terms like a 1 in 50 year flood or a 1 in 100 year flood. What they mean is the largest flood that has occurred in the last 50 years or the last 100 years. These two floods might be the one event. But generally the longer the period of time the bigger the flood. The problem is this. Do we have reliable flood records that go back 100 years or are we just guessing? You will see below that the Eastern Freeway operators refer to a 1 in 200 year flood. But do we have flood records going back that far? John Batman signed the treaty with the aboriginal elders in 1835 after which Melbourne was founded. That is 182 years ago. So the answer is, no we don't have flood records going back 200 years. The 1 in 200 year flood they talk about is a really a guess. It may be an informed and calculated guess but it is still a guess. Do we have flood records for the last 100 years? The council's flood model is based on the largest flood that has occurred in the last 100 years, the 1 in 100 year flood. (minutes p116 5.) Were we keeping accurate flood records in 1917? We most likely were. Early flood levels were often obtained by studying water marks in old government buildings such as post offices, etc. I know at Shoalhaven in NSW when they wanted to record the levels of old floods they went around looking for water marks and water damage in old post offices and other old government buildings. (I remember Shoalhaven in particular because they had several elderly locals trying to date the water marks on the walls of the post office. They were trying to date water lines 5 or 6 feet up the wall. Then one elderly local said "what about that one up there" and pointed to a waterline two stories up. I was told there was silence in the room as people gasped. But they found the flood level they wanted.) But how comprehensive a picture does this old data paint. The water level at one point is known, but you then need to make assumptions regarding water depths at other points up stream and down stream. These assumptions may (or may not) effect the outcome of the computer model.
Problems with the LiDAR. Some may say that LiDAR accurately tells you the shape of the land. Actually, it does not. The problem of 'thinning'. What LiDAR does is tell you the elevation of the highest points on your land. For instance LiDAR bounces laser light off the roof of your house back the the measuring aircraft. It also bounces light from the top of the canopies of the trees on your property back to the aircraft. If you only have a few trees on your property, and the LiDAR is able to get reflections from the ground around those trees and around your house, then you can take a pretty good guess of the ground level under the trees and under the house. But what happens if you have a heavy canopy of vegetation on your property and the LiDAR cannot get reflections from any ground on your property? Then you start to run into problems. What happens in these situations is a process of 'thinning' takes place (Sometimes in the minutes they call this 'tinning' but that appears to be a typographical error). Thinning is where vegetation is manually removed from the LiDAR data and the ground level is 'guessed'. I need to emphasize the word 'guess' here. Remember that no one came to properties that were covered with heavy vegetation to inspect the slope of the land prior to thinning the tree canopy. What they did was guess the shape of the land under the trees. And sometimes they get it wrong. (See minutes p297 point 150, p312 point 179.) However, after people objected, many of these properties were actually inspected. The problems involved in 'thinning' has lead to several errors in the model results. Problems arise usually when properties were heavily covered by trees and there were steep slopes under those trees. The lay of the land was guessed and sometimes, in fact several times, wrong guesses were made and the model gave the wrong results. (See minutes p430 point 335.) Also sometimes thinning was done incorrectly. (See minutes p426 point 330.)
The problem of changes to the landscape. The LiDAR data was captured in 2009. The problem is that people have made changes to their land since 2009. For example driveways have been excavated, low points have been filled in, sometimes garden features significantly change the topography of the land. Often these changes impact the flood model and the extent of the flood overlay it produces. The problem is that sometimes the council recognizes the changes and revises the flood model. Other times they ignore the changes and retain the flood overlay without taking changes in the landscape into account. Please see the council minutes page 235 point 36. Developments made to the terrain after 2009 are not reflected in the 2009 LiDAR data. The point is made that flood areas will be updated when and if new LiDAR data is gathered. Until that time, the flood shape will be retained. Now see minutes page 313 point 181 and page 323 point 202 where changes have been made to the land-form after the LiDAR data was collected and the changes to the land were taken into account to bring about changes to the flood overlay.
Problems with the Model Resolution. Remember that the computer model is made up of 5 x 5 meter squares or 3 x 3 meter squares of land. Each of these squares is assumed to be perfectly flat and the entire square is at ONE elevation (i.e. height above sea level). Inside the computer, the world is seen as a strange terraced landscape of small squares. So what height do we assign each of the squares? Well, the answer is we use the LiDAR for that. But the LiDAR provides a much higher resolution and so for any given square the LiDAR will provide many values for the elevation of that tile above sea level. What we need to do is choose ONE height and use that elevation for the entire square. This may not create a problem. But sometimes it does. If you walk along George Street you will see that, being a road without kerb and channeling, it has deep ditches each side of the road to take rain water away. What the computer model does – sometimes - is chose a low point in the LiDAR data and then assigned that elevation to the entire square. (See minutes p279 point 121.) When this happens the entire 5m x 5m square will be assigned one low and unrepresentative elevation. And what do you think will happen should that square of land overlap your property. The computer model will see a low point in your property and when flood water starts flowing, that low point may be seen as flood prone. In real life there would be no flooding on this square of land. But because of the way the model works, a particular tile can be shown as flood prone because an unrepresentative low elevation was assigned to that tile.
Minor Incursions and Odd Shapes. If you read through the minutes you will see that many properties had minor incursions of flooding removed from them. This was because a minor incursion of flooding might be because that particular square was assigned a lower elevation than it has in real life. Many dozens of minor flood incursions onto properties were deleted from the flood model. (minutes p104 2.10, p121 2.21, p122 2.32) Another process they went through was trimming the flood area where again minor incursions that formed odd and unrealistic shapes were removed from the flood model. (See minutes p480 point 412 and elsewhere.) All this was due to the model 'resolution'. That is the tiles the landscape was divided up into were not small enough to accurately represent the shape and elevation of the land.
Catch Drains. Model resolution gave rise to other problems. Because the model assumed the landscape divided up into flat tiles of 5m x 5m, often small catch drains were missed altogether. A catch drain is usually a channel that diverts water away from low lying land. The flat 5m by 5m squares of land did not pick up many of these catch drains. This may seem a small thing, but it led to the model saying that some properties would flood when in real life they would not. (See minutes p471 point 397 and p483 point 418.)
Problems with 'Roughness'. Up until now all I have described the squares the landscape is divided into as being flat and smooth tiles that collect rain water that allow it to flow unimpeded down onto lower tiles or into drains. But the ground is never smooth and flat. Often the ground surface has ridges and furrows, garden features, walls, etc that impede the flow of water. This unevenness needs to be incorporated in the flood model. What they did in the computer model is apply a thing called 'roughness' to each tile. From what I can gather, roughness was represented as a number. For example, roughness could range from 0 to 100. Zero says the tile presents no impediment to the flow of water while 100 would indicate that it may have ridges, walls, garden features that completely prevent the flow of water from or over the tile. (See minutes p266 point 76.) The way this 'roughness' number was calculated was by someone manually looking at aerial photographs and then assigning a number to each tile that they thought represented the unevenness of the ground as seen in the aerial photograph. (See minutes p391 point 296.) The first problem with this is that it is a pretty subjective process. There may be a lot of experience involved but there is also a lot of guess work. For instance, you are trying to assess the height of garden features, walls and the like by looking down on them. Which is not the best way to do it. The second problem is there is no direction associated with the roughness. In real life you can have straight walls or long garden features that prevent water flowing in one direction but allow it to easily flow in another. This is not captured by a simple number. The council minutes says that surface unevenness was incorporated in the computer model by this 'roughness'. But as you can see, it is not really a good way of doing it.
Problems with Missing Pipes. If water drainage pipes are not included in the model, you might get flooding in the model, when in real life there will be none. The flood model excluded several drain pipes and as a result showed flooding on some private property which would not happen in real life. (Minutes p288 point 118.)
The Eastern Freeway. In particular it appears that pipes under the Eastern Freeway had been excluded on more than one occasion. (Minutes p525 point 483.) This led to a rather humorous situation. The council's computer flood model showed that a certain tunnel on the Eastern Freeway would flood in a 1 in 100 year flood. And they let the people who operate the Eastern Freeway know this by applying a flood overlay. (See minutes p565 point 555.) The operators of the Eastern Freeway were not amused. They had designed the freeway to handle a 1 in 200 year flood by putting in a lot of large drainage pipes. Unfortunately these drainage pipers were not in the council flood model. You can tell that the Eastern Freeway operators were a bit annoyed. They did not make a 'submission' to the council along with the rest of us. Instead they had a little 'talk' with the council in which I assume they pointed out to the council the error of their ways.
Private Drains. Also drains on private land were not included in the model. A private drain is where you or I would install drainage pipes to address a water drainage problem on our land. This is probably fair enough. The council does not control or maintain private drains. They do not know their capacity and worst of all, you or I could remove them without telling the council. So the general rule was that private drains are excluded from the model. But that was not always done. The council flood model showed that the Pines Supermarket is subject to flooding. (See minutes p633.) I know this seems odd given that the supermarket is on a bit of a hill surrounded by land sloping away from it, but this is what the flood model showed. In particular the Target Store at the Pines would be under water in a 1 in 100 year flood. In this instance, the council took private drains into account and removed the flood overlay from the supermarket. The same thing happened with a retirement village where they missed some drainage (I assume pipes) from their model. (See minutes p642 and page 525 point 483.)
Conclusion. We can see that the computer flood model can be very useful in that generally it will describe where water will flow and the depth of flooding on land. However, it is really an approximation. The very nature of the computer model means that it is a simplification of the actual problem, includes many assumptions and will miss or overlook certain details. It frequently did not pick up shallow drains for instance. It is not able to see the effect of walls on private land. Sometimes drainage pipes were not included in the model because the council was not aware of them. Sometimes the lay of the land was guessed because properties were heavily covered by trees. The point is that the computer model will give reasonable and useful results, but these results could be in error and need to be checked against what is actually there. Drains, topography, walls, etc. need to be checked. In fact the council is quite aware that their flood mapping is not that accurate and requires revision and correction. They are aware that the computer model is only an approximation and contains assumptions and simplifications. They hope to sort out the accuracy of the flood maps and the extend of the flood overlays when an application is made for a permit to build on land subject to flooding. Please see page 192 of minutes:
| |
| Views: 938 | Added by: Blogger | |