4:44 AM Council Rates | ||||||||||||||||||||||||||||||||||||||||||||||||||||||||||||
Could Manningham Council reduce the rate burden of all residents? Yes I think they could and I think they could do so easily.
Dramatic Increases in Council Rates. Below is a table of the total rates paid by Manningham residents over the last 8 years. Every year shows at least a 5% increase or more in rates. For some years the increase is significantly greater than 5%. These figures are taken directly from Manningham Council's annual reports.
First a bit of explanation. 1) General rates and waste charges increase independently of each other. For instance, general rates and waste charges increased between 2012 and 2014 as follows:
2) Cash or cash equivalents is cash on hand, cash at bank, term deposits, etc. 3) Recreational land rates are fees the council charges clubs to use facilities on council lands. It usually totals around $100,000 per year.
Do people's salaries keep up with this? Not really. People's salaries do not increase anything like our council's rate bills.
What does the A.B.S. say about salary increases in Australia? The Australian Bureau of Statistics records salary figures for Australia, for men and women at a state by state level and national basis. They record the actual increases and then they perform some adjustments to arrive at the 'trend' over the same period. Let me summarize the ABS figures for salary increases between Nov 2012 and Nov 2013:
The first thing we can see is that our before-tax salaries, for 2012-2013, increased significantly less than the 5.5% to 8.2% that council rates and charges increased.
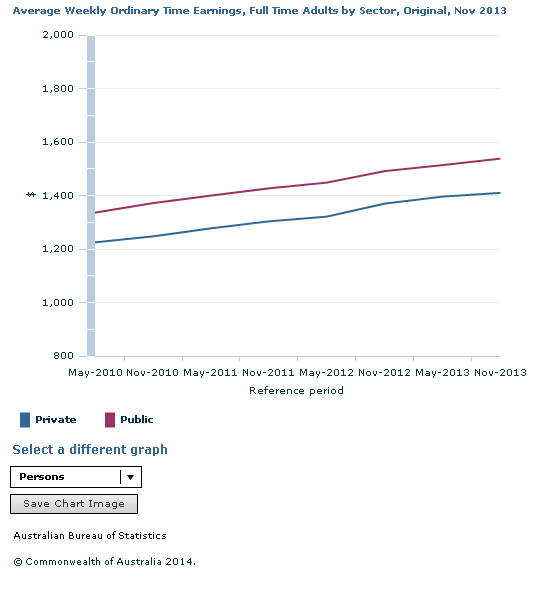
The A.B.S. also record pay increases for private and government jobs. The A.B.S. also provides this graph:
This graph shows ordinary time only and excludes overtime, working at home, weekend, etc. What we can see is that salaries in the private and public sector increase at roughly the same rate however public sector employees earn significantly more than private sector employees, on average $208.20 per week more. The A.B.S. is telling us that, on average, government employees earn some $10,800 per year more than their counterparts in private industry. And that this has been the situation for many years.
How do Manningham Council employees compare? In section 4.3.1 of the Manningham 2012/2013 budget, we see that salaries of Manningham Council employees were to increase by 4.0% during 2012/13. The salary increase for Manningham staff for the following year, that is 2013/14, is budgeted at 4.2%. If you compare Manningham's salary increases to the A.B.S. figures given above, we see that Manningham's salary increases are above the national average for Nov 2012 to Nov 2013. However, recall that the A.B.S. trend figure of 3.2% given above for the average salary increase for all Australian workers is made up of both private and government workers. If the pay increases for Manningham employees are typical for government and local government employees (and there is good reason to think this would be the case) then we can see that the pay increases given to government workers necessarily 'pulls this average up'. What I mean is, the pay increase given to people employed in the private sector would need to be proportionately less than 3.2% so the average increase for all employees, both government and private, works out to 3.2%. What this means is that if government salaries are above the national average, then private sector salaries must be correspondingly below the national average for the mathematics to work. (Although mathematics has been known to do some strange things. If you follow the link above to the A.B.S. site where I obtained the public/private sector graph, you will see 'Table 4' which summarizes weekly earnings by sector. Note how the Public sector full time employees salaries went up by 3.4% but TOTAL public service employees salaries went up by only 2.0%. Note also in the private sector where full time employees went up by by 3.0% and 2.9% but TOTAL private sector employees salaries went up by 3.4%. There must be a lot of part time and temp. workers in the public service who get next to nothing in pay rises, while in private enterprise, the part time and temp. workers are getting the massive pay rises. There strikes me as being something very odd about this.)
So, could Manningham Council reduce the rate burden of residents? Yes, I think they could. First, notice the table at the very top of this article. Notice the cash on hand column. This is basically cash that Manningham Council has in the bank. It is money they have saved from their revenue, that is their income streams, one of which would be council rates. Manningham Council has consistently had $30m to $50m saved away in bank accounts earning interest. Some may say that this money is earmarked for certain projects. But I think that would be incorrect. You can see in the table that similar large amounts of money have been in the bank over a long period of time. You can see that Manningham Council dips into these savings as required. To date, I have not been able to find any information that would indicate this money is reserved for specific projects. Much of this cash in the bank could be returned to the ratepayers as ongoing reduced rates. To meet their fluctuating demands, Manningham Council would only need to have around $15m as cash on hand.
Second, note that Manningham Council has been able to save this large amount of money despite their rather wasteful management of funds, projects and staff. If you read through other articles on this news site, you will see where I have been able to give instances where staff were actually sleeping on the job and Council management were prepared to defend this inexcusable time-wasting activity. You will see instances where Manningham Council allow themselves to be exploited by contractors and suppliers who inflate prices to unreasonable levels and council management takes no steps to reign this in but accepts the high prices. You will also see examples where Manningham Council does not give adequate attention to cost control or reduction as they prepare their plans. Given this waste, self-serving laziness and lack of attention to cost control, the council is still able to save some $40m from the money it takes in. If Manningham Council were run in a financially responsible way, (that is, the way a private company would manage costs), then there could be even greater reductions in the rates charges to residents. It appears that the council's understanding of 'financial responsibility' (or 'financial sustainability' as they like to say) is not the same kind of responsibility most of us understand it to be.
28 May 2014 | ||||||||||||||||||||||||||||||||||||||||||||||||||||||||||||
| Views: 1246 | Added by: Blogger | ||||||||||||||||||||||||||||||||||||||||||||||||||||||||||||