3:07 PM Even More Deception By Manningham Council | |
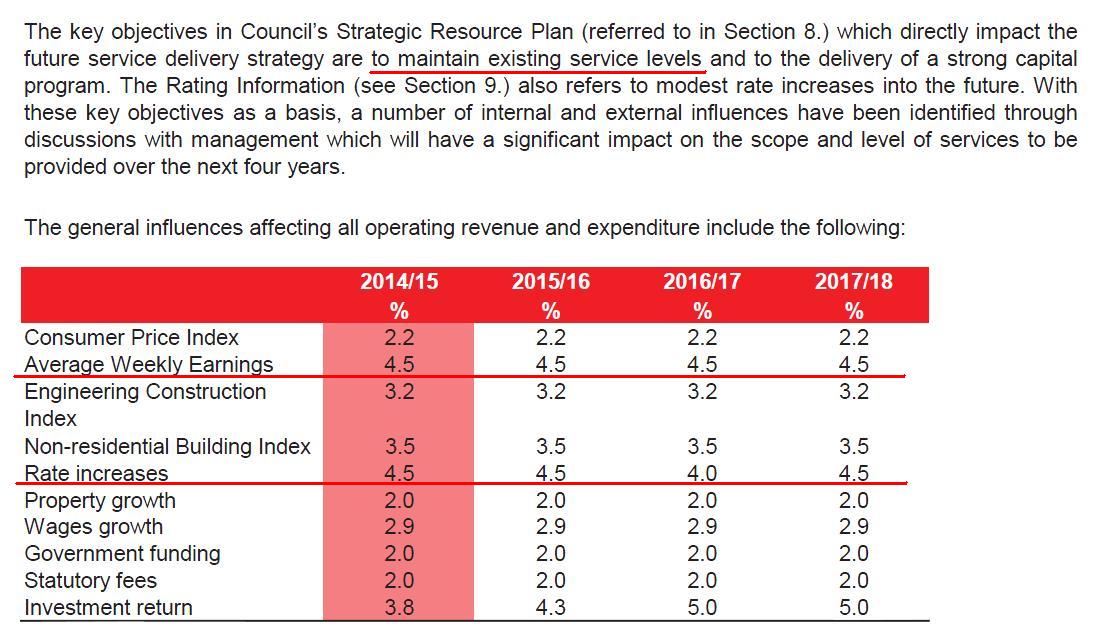
Manningham Council finds it impossible to justify a rate increase of 4.5%. Please consider this chart taken from the 2014/15 budget (page 1300 of the minutes for April 29, 2014 or page 58 of the budget for 2014/15):
Figure 1. Manningham council wants to justify the 4.5% property rate rise. But try as they might they can't. So what do they do? Let's have a closer look. We start by considering the information in the above table. This table is the only information I can find in the budget document for 2014/15 where Manningham council makes any effort to explain or provide justification for the 4.5% increase in property rates. It does this by looking at things that effect the council's costs and expenditures. Manningham council refers to these things as 'internal and external influences'
Let's take a look at these influences. People often compare the increase in property rates to the increase in the CPI, which our council says is 2.2%. Manningham respond by saying that their cost structure depends little on CPI ( i.e. on the increasing cost of consumer items) and as such the councils increases in property rates should not be compared to the CPI increase. Manningham council also say that their cost structure is more dependent on things like wages, roads, etc. So Manningham council has produced a table for us showing the cost increases for various sections of the economy. And it is at this point that wrong assumptions start to lead us ratepayers down the wrong path. We tend to think that if the council keeps services and capital at pretty much the same level, which they basically say in Figure 1 above, then increasing costs drive the increase in property rates. That is, if the cost of wages goes up by 2.9% then our rates need to go up by 2.9% and so on. But unfortunately, cost increases are not the big driver behind the increases in council property rate. I will go into the details of how and why our property rates increase shortly. But for now, let us consider these cost indices the council has provided in Figure 1. You will notice that nearly all of these price indices are well below 4.5%. The Investment return index measures the interest the council earns on money it invests. It is not a cost but a source of income. All the indices for increases in costs in areas such as Engineering construction, non-residential building, wages and so on, are well below 4.5%.
So if we accept Manningham council's word that they plan to 'maintain existing levels of service' (Figure 1 above), maintain funding of capital projects at 33% of income, and they plan to only increase staffing levels by 0.5 person for 2014/15 and plan no further staff increased for the following three years (page 1294 of minutes for April 29, 2014) then how much do you think our property rates should increase based on increasing costs to the council? I myself would think somewhere around 3 to 3.5%. But since the largest proportion of our rate money goes to staff pay, which the council projects to be 2.9% for the next few years, I would tend to think the rate increase should be toward to lower end of this range, that is somewhere around 3%.
So how does Manningham council justify a 4.5% increase in property rates? Is there any justification? Is there anything in the chart in Figure 1 that lends any support to a property rate increase of 4.5%? The only thing I can find is the increase in Average Weekly Earnings. There is nothing else in the chart, or anywhere in the budget or minutes that I can find, that lends any support to justify a 4.5% increase in property rates. I also find it interesting that the council includes two wage-related indices as 'external influences'. These are Average Weekly Earnings and Wages Growth. I would have thought that growth in Average Weekly Earnings would be included in the calculation of Wages Growth and it would be superfluous to include the two. Also I am curious how the figure for the increase in Average Weekly Earnings exactly matches their figure for the increase in property rates. I have a very simple question at this point, 'Does Manningham council think the increase in Average Weekly Earnings somehow justifies the increase in property rates?' Manningham Council does not say they derive the increase in rates from the increase in Average Weekly Earnings. But what are we to think? Well, Manningham council would never say there is a connection between these two figures for several very good reasons. First it would be outrageous. Our council would be increasing property rates not based on the increases in their costs, but simply on people's ability to pay, i.e. what they think the can get out of people. While I think most of us would consider this to be outrageous, I hope to show below that something very much along these lines is actually taking place. Second. The figure they use for Average Weekly Earnings has no basis whatsoever in any Australian Bureau of Statistics information that I can find. It is a bit of a mystery where this figure of 4.5% for Average Weekly Earnings comes from. This Average Weekly Earnings number is quite important. It may be used by the council to calculate the pay increases for their staff and, as I will show later on, it gives an expectation to the council of the increase in property rates that the community can comfortably bear. But most importantly for now, where does this figure come from?
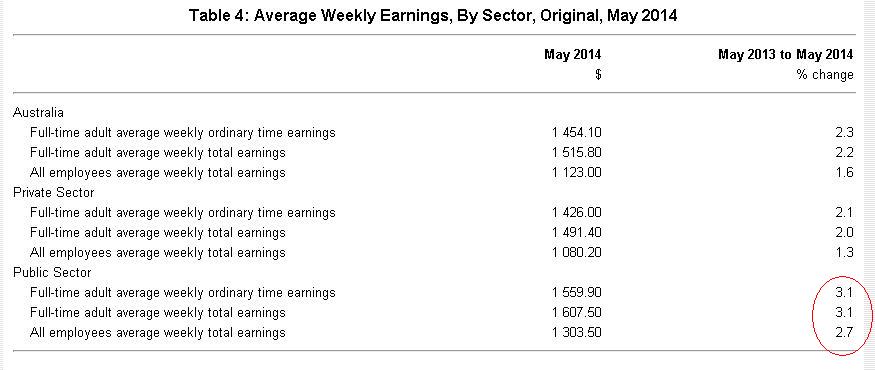
Where does Manningham Council get this incredible number for the increase in Average Weekly Earnings from? Please consider this table from the Australian Bureau of Statisics.
Table 2 This is a chart of Average Weekly Earnings for the 12 month period ending May 2014. As you can see, none of the ABS figures are anywhere near 4.5%. The public servants come closest with 3.1% but the rest of us make 2.3% per annum increase, at best. And, just for completeness, notice that the ABS gives figures for adults, and then for all employees, and for ordinary time and for total time. Not one of their numbers comes anywhere near 4.5% no matter which way you look at the figures. So how does Manningham Council get 4.5% from ABS figures that are around 3%?
For the time being, let's give Manningham Council the benefit of the doubt. Average Weekly Earnings could dramatically increase if there was a corresponding decrease in income tax rates over coming years. But as you can see here and here, there has been no decrease in income tax rates between 2012/12, 2013/14 and 2014/15. So that is not the case.
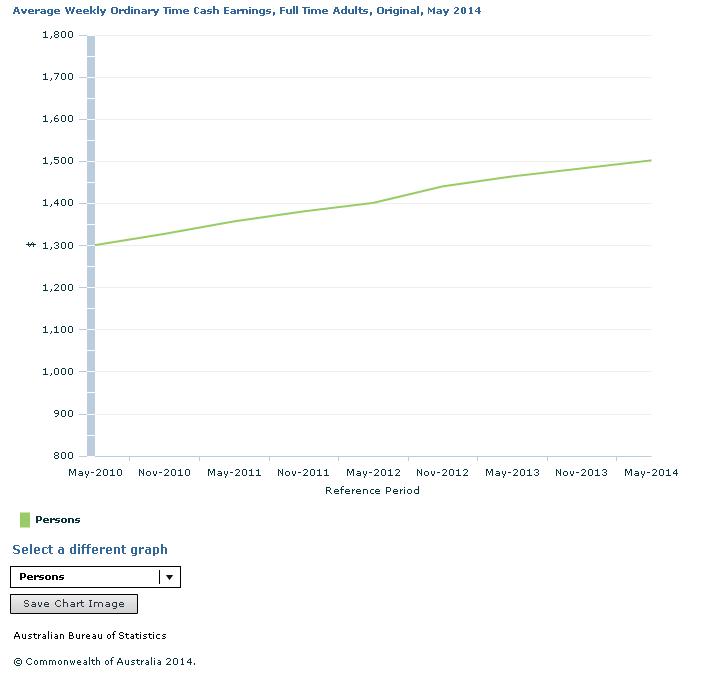
What else could be going on? Could salary sacrifice arrangements bring about this big increase in Average Weekly Earnings? According to the ABS, the Average Weekly Earnings calculation excludes salary sacrifice arrangements. When you take salary sacrifice arrangements into account you get a different number called the 'Average Weekly Cash Earnings'. You will note that our council does not use 'Average Weekly Cash Earnings'. Manningham council says their figure is 'Average Weekly Earnings'. But let us give our council the benefit of the doubt and see what the numbers are for 'Average Weekly Cash Earnings'. Below is a graph, again produced by the ABS, showing the Average Weekly Cash Earnings growth over a 4 year period. It combines statistics for both male and female adult full time employees, ordinary work hours only.
Figure 3 Over this 4 year period, Average Weekly Cash Earnings increases nearly linearly by around 3.8% pa. over the May 2010 figure. However, if we look at the increases as a percentage increase over the prior year, we notice that the percentage increase gets smaller as we go forward. This is because the amount of change remains approximately the same but the prior years number you use to calculate the increase is getting bigger and bigger as you go along. And so, the percentage increase over the prior year works out to be smaller and smaller. Please check my percentage increase figures in the table below with a calculator to see how this works. These figures have been taken manually from the above chart. And even though they may be slightly inaccurate, they still serve an important purpose. Approximate Approximate Date Figure % Increase over prior year May 2010 $1300 May 2011 $1366 5.08% May 2012 $1422 4.10% May 2013 $1471 3.45% May 2014 $1516 3.06%
Even from these approximate figures we see that the ABS's Average Weekly Cash Earnings figure lends no support to Manningham Councils figure of 4.5% for Average Weekly Earnings for 2014/15.
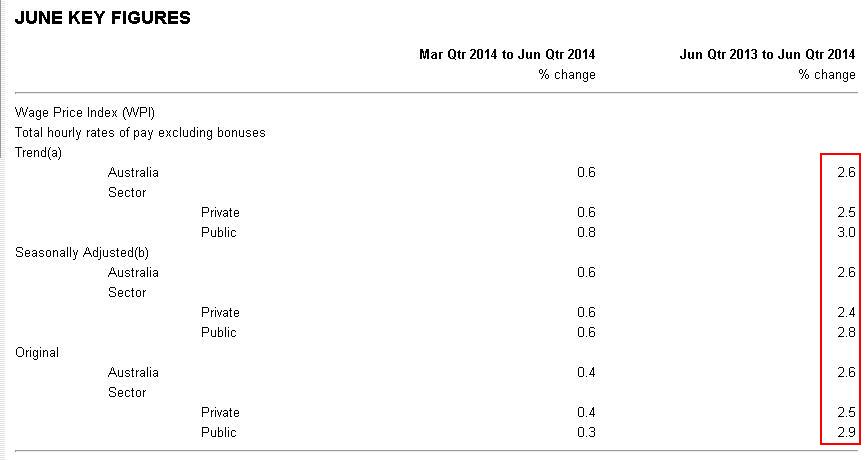
So where does Manningham council get this 4.5% figure for Average Weekly Earning? So far no ABS statistics gives any support to it. But lets give Manningham council the benefit of the doubt again and look at another measure of increasing wages. Could Manningham Council be using the 'Wage Price Index'? The Wage Price Index is calculated slightly differently to Average Weekly Earnings. Again, please consider this chart from the ABS for the Wage Price Index.
Table 4 Again, the ABS's figures for the Wage Price Index lend no support at all for Manningham Council's figure of 4.5% they give in Figure 1.
As far as I can tell, the 4.5% figure Manningham council uses for increases in Average Weekly Earnings is a complete fabrication. It simply has no basis in any ABS statistic I can find regarding increases in earnings or wages for 2013 to 2015. This is why Manningham Council would never dare make a connection explicitly between their Average Weekly Earnings figure and the increase in property rates figure. The most they could do is simply put the fabricated figure in front of you and hope that you will make the connection yourself.
Manningham Council is always ready for your criticisms. Notice the language that Manningham council uses. These price indices are 'influences' and nothing more. If anyone were to point out that their numbers are totally unsupported by ABS statistics, the council could easily turn around and say, 'we never based property rate increases on Average Weekly Earnings! These are only general external influences. There are other things that effect our costs and expenditure. And we never said that we use this figure to calculate our wages" If there is one thing Manningham council is good at, it is office politics. Could Manningham council stoop to anything as low as this? I will explain shortly that they can. For the mean time, the simple truth is that the 4.5% Average Weekly Earnings figure is a complete fabrication by Manningham Council. There is no support for this figure from any ABS statisitics I can find. As such it lends no support to the 4.5% property rate increase.
Plundering ratepayers. So how are our property rates calculated? How does Manningham council arrive at increases that range from 4.5% or more per year? In summary, according to the council's own documents, the process of calculating property rates works something like this. Manningham council essentially comes up with a 'wish list' of what they want to do in the next financial year, i.e. what they want to do and who they want to employ and so on. Then they calculate the cost of this wish list. This cost is then spread out to the ratepayers and it becomes the amount that is collected. In short, we simply have to pay it. This process is spelled out clearly in documents the council has produced. I have commented on the documents and processes in detail in other articles on this web site. This process is even hinted at vaguely in the text at the top of Figure 1. It says 'With these key objectives as a basis', that is with what they want to spend in their capital program and services program as the basis of the rate increases. They then say they had a discussion among themselves to come up with 'internal and external influences' which 'impact the scope and level of services'. That is, these costs aren't the main driver to increases in property rates. The big driver behind council rate increases is not increasing costs, but their 'wish lists'. This is the main reason why property rates increase far above all the cost indices the council lists in Figure 1. At the very start of the planning and budgeting process, as Manningham council is putting together what they want to do in the coming financial year, they need to calculate an increase in property rates that they think the community will accept and can bear. No double, one of the inputs to this calculation is the Average Weekly Earnings figure. If they think peoples take home pay has increased by a certain amount, then aren't they justified to think they can safely increase their property rates by the same amount and not draw undue criticism? As I said above, the main driver behind the increases in council property rates is not increasing costs, but what they think the community can bear. It really is that outrageous and that self indulgent. I have gone into far more detail in other articles and in them refer to council documents where this process is described.
Many will say the residents are just unappreciative and thankless. Many will say that this is all done for us. The council takes our money to spend on us so we will all be better off. If only that were the case. A very large amount of that money is wasted through sloth, laziness, poor cost management, poor management of processes, very poor attention to cost reduction, excessively large salaries, pointless jobs and poorly managed staff. My point is that if the same job were done by private enterprise, the costs would be dramatically reduced and the property rates would be reduced according. Unfortunately most of the managers and other staff in our council have had very little or no experience at all in private enterprise. They have moved from one government job to the next and think and act accordingly.
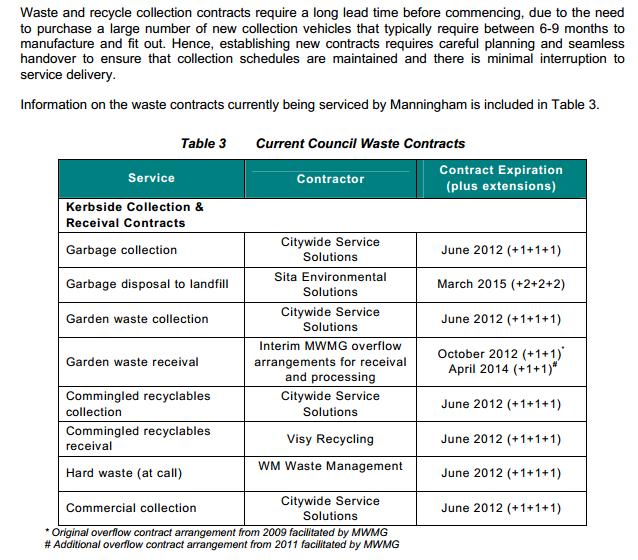
But do we really have cause for complaint? If I calculate that our rates should increase somewhere around 3% and Manningham council delivers an average rate increase of 3.8% then what on earth am I complaining about. Surely 3.8% is close enough to 3%. Yes it is. But there is a big problem. The 3.8% is not 'sustainable'. And I use the word 'sustainable' not as Manningham council does, but to indicate that Manningham council cannot keep delivering a 3.8% overall increase in rates year after year. This figure of 3.8% is, as far as I can tell, probably just another one-off. Please allow me to explain. First, our property rates increase by 4.5%. However waste charges this year stay the same as last year. When you take this into account for the average rate payer, the increase for 2014/15 is 3.8%. But do you know how the council keeps waste charges unchanged for 2014/15? For example, has there been dramatic efficiency improvements in the council's waste collection program or in the administration of that program? Not at all. Did you know that private contractors carry out waste collection in Manningham? These contractors are privately run companies that Manningham council uses to collect our rubbish. If you read the 'Interim Waste Management Strategy' prepared by Manningham Council, on page 24 you will see a list of the contractors and the length of their contracts with our council.
Figure 5 So how is Manningham able to keep waste charges the same as last year? The answer is quite simple. It has nothing to do with savings or efficiency gains made at Manningham council. Instead these contractors have not increased their costs. Why did they keep their costs the same as last year? That also is a very interesting question. Manningham council negotiates prices with these private companies so we can only assume that costs are unchanged because Manningham council was pressuring them in some way. But note that in the 2014/15 budget and in the minutes of the April 29, 2014 meeting, Manningham council tells us how wonderful they are because they have given us an overall rate increase of only 3.8%. As I have already said, this is unsustainable. The waste contractors will need to raise their fees at some point. Their own wage costs are increasing at 2.9% per year, and their fuel costs and vehicle maintenance costs and so on also increase. Sooner or later the waste contractors costs will increase and be passed on to the council. This 3.8% is not sustainable regardless of what our Council says. When the contractor are forced to increase their fees, Manningham council will be back to it's old regime of massive overall rate increases.
Isn't it amazing. Manningham council knows full well that the residents want and that they expect lower property rates. So what does Manningham council do? As I hopefully have shown already in this and prior articles, they resort to deceit. They pull numbers out of the air. And they pressure private contractors to keep their fees unchanged, and pat themselves on the back for delivering lower rates. As you can see, they are not very good managers. Good managers would continually be finding ways that improve efficiency, reduce costs and keep costs under control. They would not be engaging in these trust-destroying games and deceptions. For Manningham council to deliver rate increases at justifiable levels of around 3.0%, they will need to do what they expect and have pressured their waste contractors to do. These contractors have had to carefully manage costs, work more efficiently and work smarter. They need to deliver real results and real cost savings to their customer which in this case is Manningham council. If Manningham council can insist that their own waste contractors improve and refine their operations and keep their charges constant, then I think we have every right to expect the very same thing of our council. And as I have demonstrated time and time again, there is massive scope for cost reduction and efficiency gains at Manningham council. Manningham council is characterized by very poor staff management, a belligerent lack attention to controlling costs, self-serving programs and indulgent pay scales, managers who know little about real management and lazy workers who treat the council as a joke and sleep on the job in full view of the residents.
| |
| Views: 1094 | Added by: Blogger | |