12:52 PM Flooding Nonsense | |
As you may be aware, Manningham council, in conjunction with Melbourne Water, recently finished flood mapping for large sections of the city of Manningham. You may have read in the Manningham Leader that some 10,000 homes are now regarded as being effected by flooding.
Some Background. Before we get too worried about this, we should look into the background. We read in the minutes of the meeting for 29 September 2015: "In July 2005, the Auditor General released the ‘Managing Storm Water Flooding Risks in Melbourne’ report, following widespread flooding of the Melbourne metropolitan area between December 2004 and January 2005. The Auditor General formed the view that Victorian Councils were not effectively managing flooding risks associated with significant storm events and recommended that Councils provide a higher level of flood protection, carry out reliable flood mapping and include the results in their planning schemes." (Page 2687 minutes 29/09/2015.) We see that as a result of the floods in 2004/2005, the Victorian Auditor General (VAGO) was very critical of the performance of many councils. We need to understand that the VAGO assesses the performance of councils and reports back to the council's superiors in the state government. One thing we can safely conclude is that Manningham Council certainly does not want to be found negligent in this area, having already been warned and criticized by the VAGO once before. It would probably also be safe to assume that Manningham Council would err on the side of caution and ensure that every property that may be effected by flooding was identified on the flood maps. If you study the flood maps produced, it seems they have done precisely that.
What are flood maps? To understand how this flood mapping works we need to be aware of the following:
Problems with the flood maps. When you study the flood maps, you can see that they were calculated on a computer. Sometimes the results are a bit strange and unrealistic. For instance.
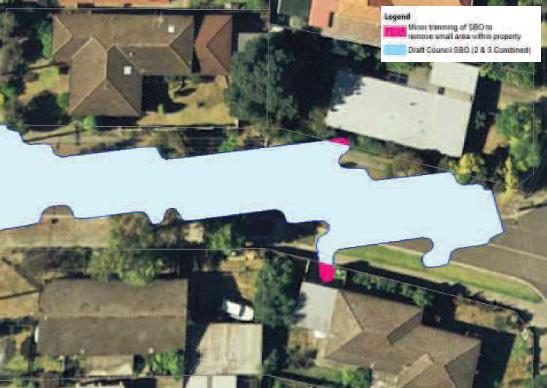
For example, the image below shows unrealistic water pooling which most likely comes about because the computer interpolated gradient lines and also did not take into account the changes in land form due to the road. Most road surfaces are uniform in contour and water would simply not collect on the road as suggested in this image.
There are many other examples. If you download the document "Part 1 Amendment C109 – Flood Mapping of Local Catchments.pdf" and enlarge the various flood maps toward the end, you will see some very strange predictions of flooding. The flood maps are not a precise measurement. There are a lot of assumptions made in their preparation and not all these assumptions are correct.
How the flood mapping was done. Manningham Council used techniques developed by Melbourne Water, used Melbourne Water themselves or used consultants working under the supervision of Melbourne water to prepare and check the flood maps (pages 2691, 2691 minutes). Manningham council then accepted the results of the flood mapping as 'robust' (page 2691). This is interesting in two regards. First Manningham council does not need to take responsibility for the accuracy of the flood maps. The council can rightly say that the maps were produced using the techniques developed by Melbourne Water or were prepared under the supervision of Melbourne Water and so Melbourne Water is essentially ultimately responsible for their accuracy. On the other hand, even though Melbourne Water prepared or checked the flood maps, Melbourne Water is not responsible for all the areas covered by they flood maps. Melbourne Water is responsible for the major watercourses and major overland flows. Manningham Council will manage the other areas not managed by Melbourne Water. The special building overlays proposed by the report clearly highlight this demarcation of responsibility. Land subject to LSIO (Land subject to innundation overlay) and SBO1 (Special Building Overlay 1) are the sole responsibility of Melbourne Water. While land subject to SBO2 and SBO3 are the sole responsibility of Manningham Council. While Melbourne Water exercised due care in preparing and checking the flood maps for Manningham Council, I don't think they are going to be too concerned about errors in the maps for areas affected by SBO2 and SBO3 overlays. In the end, it appears that Manningham Council has avoided responsibility for the accuracy of the maps and similarly Melbourne Water is simply not responsible for the areas effected by SBO2 and SBO3 overlays. This is typical government work and typical government office politics. "Always have an excuse ready". And as usual, it is going to be the public who has to live with, fight against and pay for the consequences of these antics and any errors that were made.
Just how good are these flood maps? Having little to do one Saturday morning, I chose four spots at random from the Council's new flood maps and went and checked them out. All four places I examined were subject to Special Building Overlay 3 (SBO3). This means this land will be subject to flooding between 50mm to 100mm during a once in 100 years flood. So, the places I looked at would have flooding of a depth between 2" and 4" of water during such floods. I found that the flood map for one area was entirely plausible. But had real doubts about the three areas that I examined. The slope of the land and the small catchment areas above where the SBO3 overlay ends led me to question the accuracy of the flood maps in these other three places.
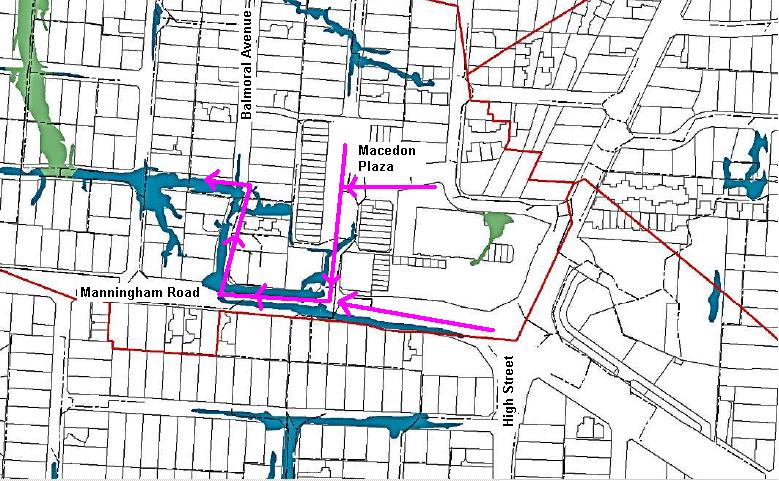
1) Macedon Plaza, Templestowe Lower - the flood map is entirely plausible. The land around Macedon Plaza shopping area is relatively flat and the flood mappiing for the area is entirely reasonable. Walking around the area you are able to confirm where the water will flow. That is, down to Manningham Road and into Balmoral Avenue. There is a dip in Balmoral avenue where the water would collect and there is already a large drain at this low point. Below is a rough diagram showing the slope of this land. The slope is indicated by the purple arrows.
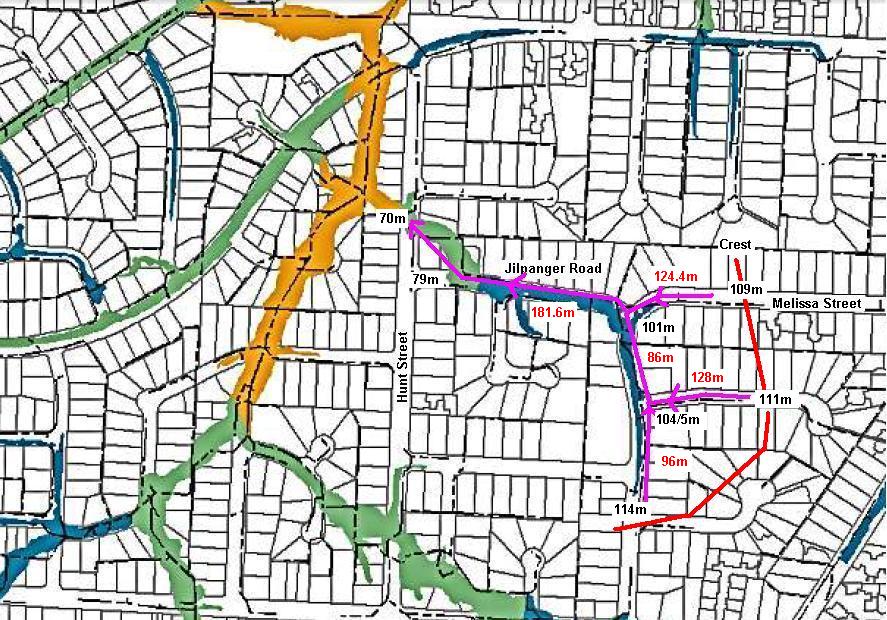
2) Melissa Street Donvale - the land is rather steep for 2" to 4" of water to build up. As I examined the other three areas, I started to encounter much steeper gradients in the land and began to question whether water would reach the depths indicated on the flood maps. I dug out my old altimeter and measured the height above sea level at several points. The numbers in black on the diagrams below are heights above sea level and the numbers in red are the horizontal distances between the points measured. (I was able to obtain horizontal distances using Google maps. Please note that my altimeter had not been calibrated at sea level however it is the relative differences in height and not the absolute heights above sea level I was interested in.) Below is a diagram of the measurements I took for Melissa Street/Jilpanger Road. The crest along the ridge of the hill is shown by the red line.
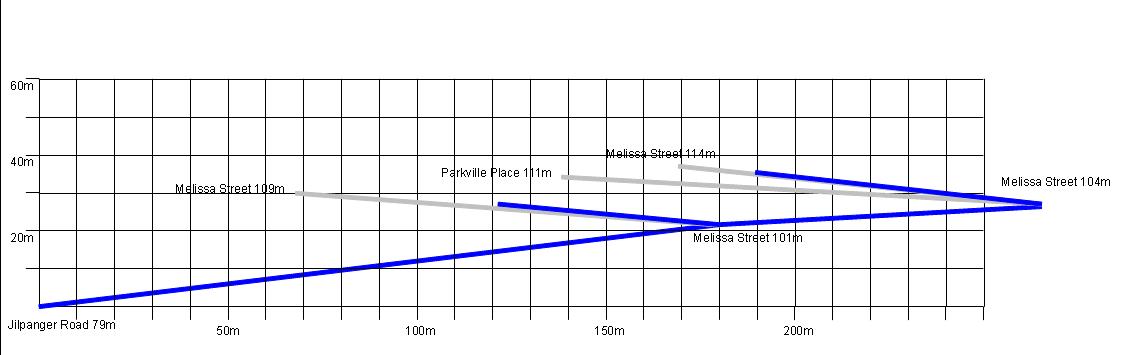
These are the gradients for this area shown to scale.
The land slopes much more than at Macedon Plaza. The blue lines show areas where the council says between 2" and 4" will gather during a 1 in 100 year flash flood. The grey lines lead to the crest of the surrounding hills. Note there is only about 100m (or less) from the crest of the hills to the places where flooding will be between 2" to 4" deep. As far as I could tell, the catchment areas that feed this flooding was not that large. The downpour would have to be extremely severe to lead to 2" to 4" of water so close to the crest of the hills. Also note the slope of the land. The water run-off would be rapid and yet the flood maps say that water would be between 2" and 4" deep on these slopes.
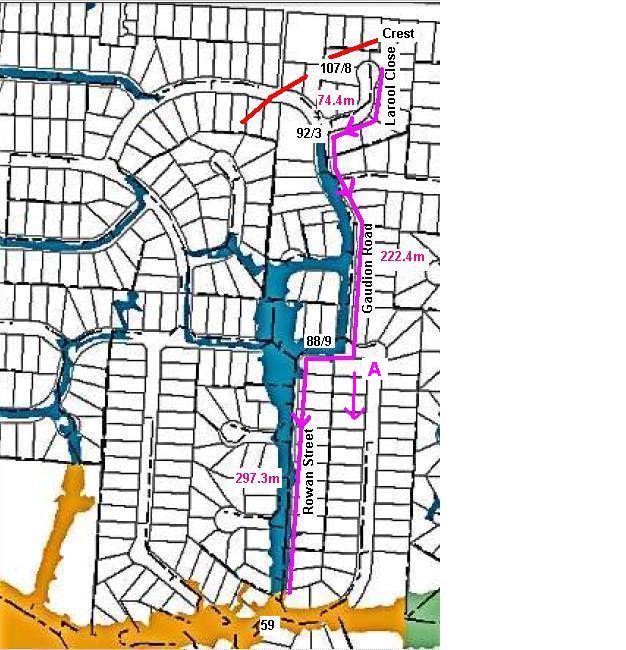
3) Rowan Street/Gaudion Road – again, rather steep slopes with little catchment. These are the measurement I took for this area:
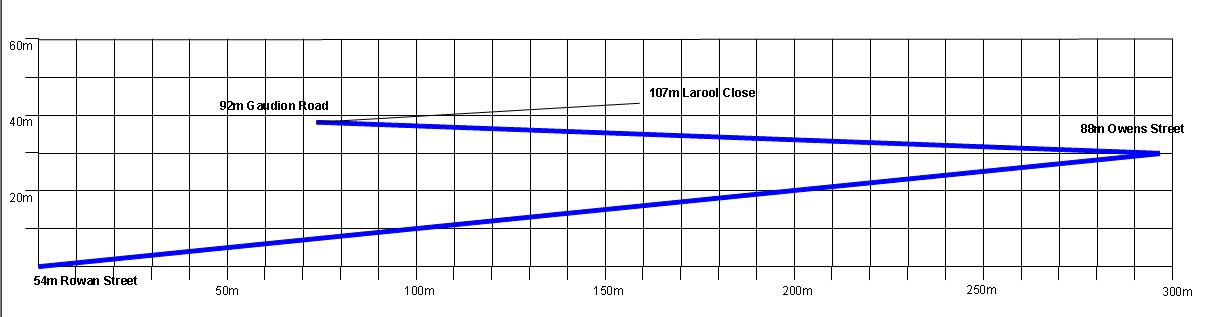
These are the gradients for this area to scale.
Again there is not that much catchment above where the blue SBO3 areas end. The crest in Gaudion Road/Larool Close is shown by the red line. Again serious flooding commences around 100 meters from the crest of the hill which does not seem that realistic.
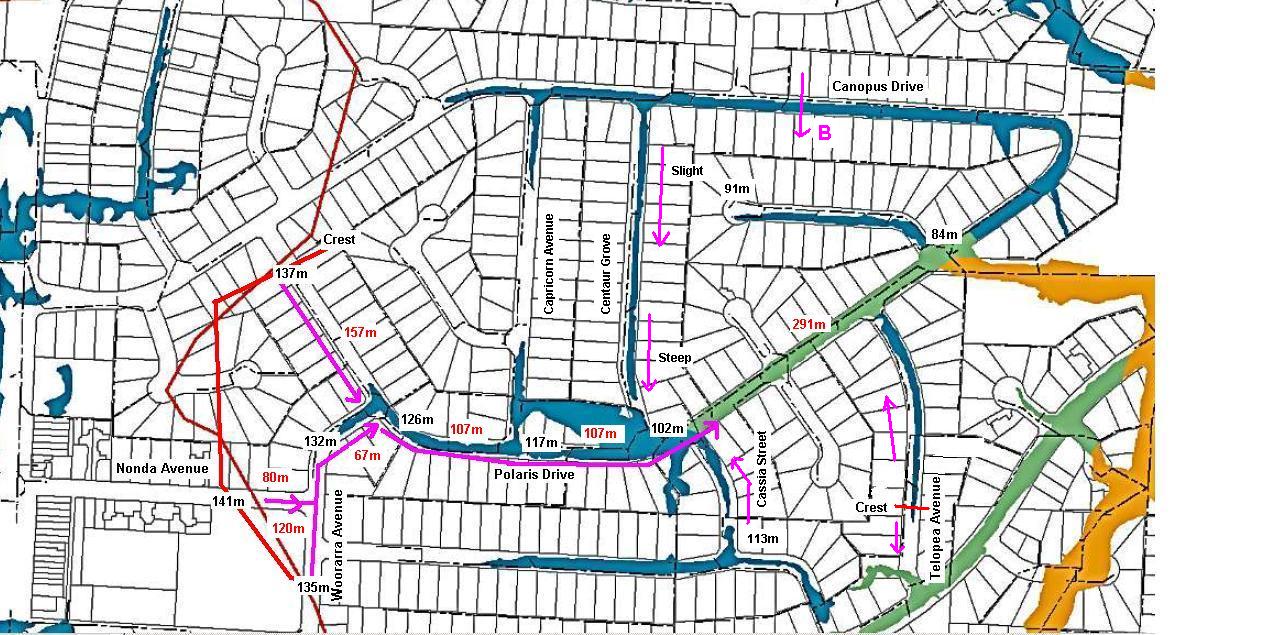
4) Polaris Drive – steep slopes and small catchments above the SBO3 areas. Here are the measurements for Polaris Drive/Woorarra Avenue.
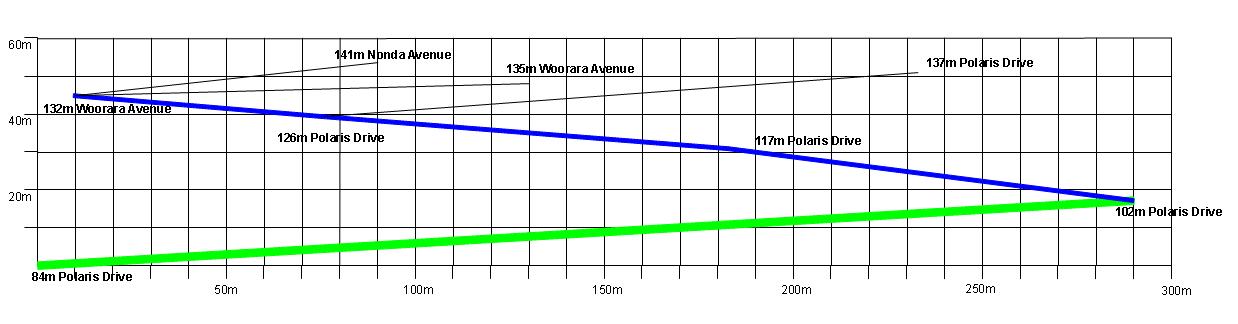
And these are the gradients for this area drawn to scale. The blue line is SBO3 (2" to 4" of water. The green line is SBO2 (4" or greater).
Again we see that some sections of Polaris Drive are rather steep for 4" of water to build up. And again serious flooding commences within around 100m from the crest of surrounding hills.
So just how realistic are these flood maps? Here are some things to consider regarding these flood maps. First, when it rains and floods is usually does so over a very broad area. The flood maps show that, in the vast majority of instances, flooding occurs just on the road reserves. The problem is that in many cases the road reserves are not the lowest point in the land. Why should the flood maps show the vast majority of flash flooding occurring on the road reserves and not on private property? This does not make a lot of sense to me. When I found one place (which I will explain below) where the flood mapping seemed to me to be just nonsense, I began to question just how much confidence the council really had in these flood maps. They are very confident to show flooding on road reserves but extremely reluctant to show flooding on private property. Why would that be? If you have a downpour severe enough to have 4" of water within 100m of the crest of a hill, then you would think that there would also be severe flooding on private property and not just on the roads. Second, did these computer calculations take water "run-off" into account? Some of these roads are rather steep and no doubt water would run down them in a flash flood. But would it build up to 4" in depth on these sloping roads as the flood maps indicate? You would think that you would need to divert a small river down some roads to get the 4" depth of water given the slope. And if you did get 4" of water on such steep roads, then I don't think that water would be restricted to the road reserves at the lowest points, as the flood maps suggest. Rather, you would think that small lakes would develop at the lowest points even if you took the existing drains into account.
More problems with these maps. If you spend some time checking these flood map you will soon realize they are riddled with errors. For instance:
a) Telopea Avenue (Near Polaris Drive). As far as I can tell, Telopea Avenue has a crest in the road in front of number 7. The council flood maps show the tail of the SBO3 area going over that crest and extending slightly down the other side. In effect the council flood maps say flood water will run back up the hill, over the crest and down the other side. It would appear the council wanted to extend the flood prone areas as far as possible.
b) Centaur Grove (Near Polaris Drive) Please check the council flood maps to see which way they say water will flow along Centaur Grove. The flood maps indicate, to me at least, that water would flow along Centaur Grove from Polaris Drive towards Canopus Drive. Note the break in the flooded area at the Polaris Drive end of Centaur Grove which indicates to me that water would flow away from Polaris Drive towards Canopus Drive. In reality the land slopes in the opposite direction. In fact as you approach Polaris Drive there is a very steep incline up Centaur Grove. The council flood maps has water flowing UP that hill.
c) Canopus Drive (Near Polaris Drive) See the area marked B on Canopus Drive. The land slopes ACROSS the road. On the north side of the road the land is higher than the road while on the south side it is lower. The land slopes down away from Canopus Drive (where the B is marked). What is strange is that while the road would be under some 2" to 4" of water, little water will run down the hill onto flood private property. Similarly there is no flooding on the north side of the road where the land is higher than the road. Why would it only flood on the road?
d) Cassia Street (Near Polaris Drive). Cassia Street, as far I can tell, slopes relatively uniformly from McKenzie Street down to Polaris Drive. Water would not collect at the top of McKenzie Street as is shown in the flood maps.
e) Gaudion Road (Near Rowan Street). See the point marked A in the map. During a flood the council says that there will be between 2" to 4" of water racing down the hill on Gaudion Road. At the point maked A, the slope of the hill continues down through private property. The only thing stopping the fast flowing water from going onto private property is a 4" high kerb (remember this flood water is between 2" to 4" deep). However the water decides that a 4" kerb is a massive barrier and decides not to go over it . Instead the flood water decides to do a 90 degree turn into Owen Street and not flood onto private property. I seems that we get very considerate flood water in some places of Manningham.
These are the mistakes I could find at just the places I checked. As you study these flood maps you see many things like this that make you wonder what on earth is going on. As far as I can tell, this whole exercise is seriously influenced by council office politics. Manningham council can now show these flood maps to the VAGO and say, "Look we have done as you asked". Also they have made sure that everywhere that could ever possibly ever flood is marked on the maps. Also they can say that if there are any errors in the maps then it is really Melbourne Water's fault and not theirs. These maps also provide benefits for Manningham Council. For example, it adds to the work they do, provides justification for more staff and, off course, more spending. Consider the people they could employ and the money they could spend administering flood maps - even though the maps are riddled with errors.
| |
| Views: 2035 | Added by: Blogger | |