8:51 AM Over a Decade of Calculated Greed | ||
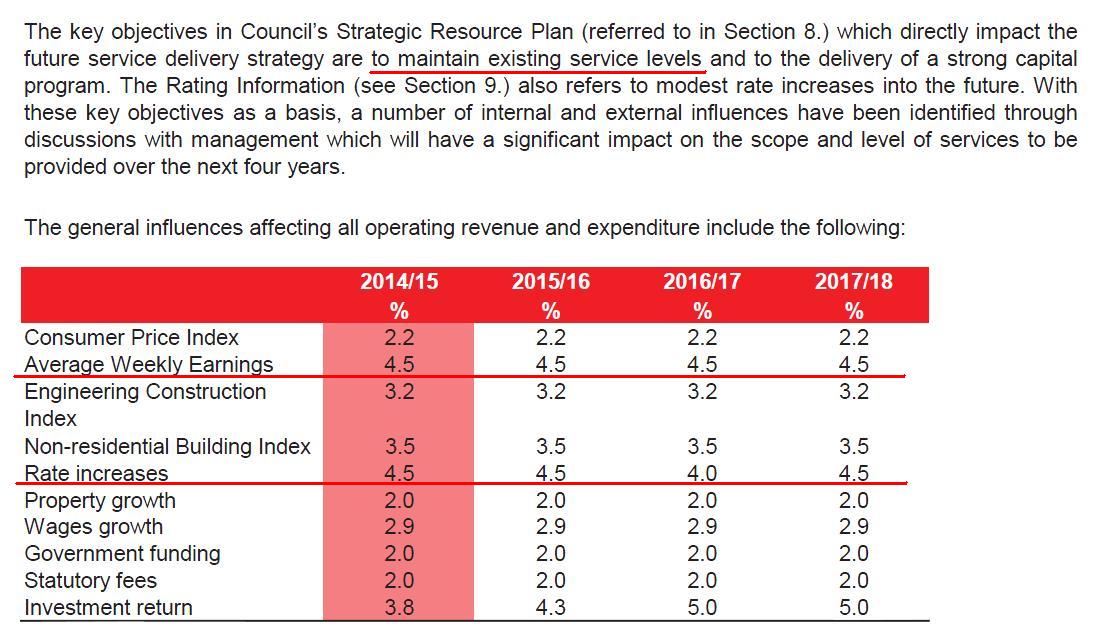
Manningham Council often refer to a number produced by the Australian Bureau of Statistics (ABS) called the 'Average Weekly Earnings' to justify either it's annual rate increase or it's staff pay increase. They did this in the 2015/16 and also in the 2014/15 budget documents. Also Manningham Council say is that Average Weekly Earnings is just one of the influences on council costs. But, if you look at the budget documents it tends to be one of the bigger numbers and is probably one of the bigger influences. To see how important this 'Average Weekly Earnings' number is to the council, let me give you the council's own numbers. First from page 58 of the 2014/15 budget (see page 1300 of the minutes for 29 April 2014) Here, Manningham council uses the Average Weekly Earnings to justify their rate increase of 4.5%:
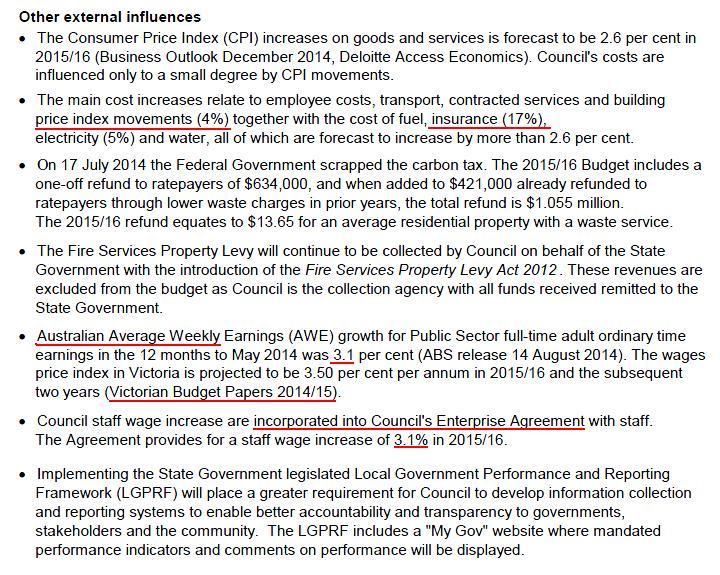
Next, lets look at page 29 of the 2015/16 Annual Budget (see page 1728 of the minutes for 23 June 2015). Here, Average Weekly Earnings is used to justify the council staff salary increase of 3.1%:
So we see that Average Weekly Earnings plays a significant role in determining increases in council rates as well as their own pay increase.
OUT OF CONTROL COUNCIL SPENDING. Let us return to the Average Weekly Earnings number produced by the ABS. We have seen that Average Weekly Earnings is a very important number that Manningham council uses to justifying their annual rate increases and increases to their own salaries. So let us do a simple comparison. Let us see how council rates have increased compared to the increase in Average Weekly Earnings over the past decade.
First we need to know how council rates have increased over the past decade. I have been able to obtain the rate increases for residential properties in Manningham going back to 2002/2003.
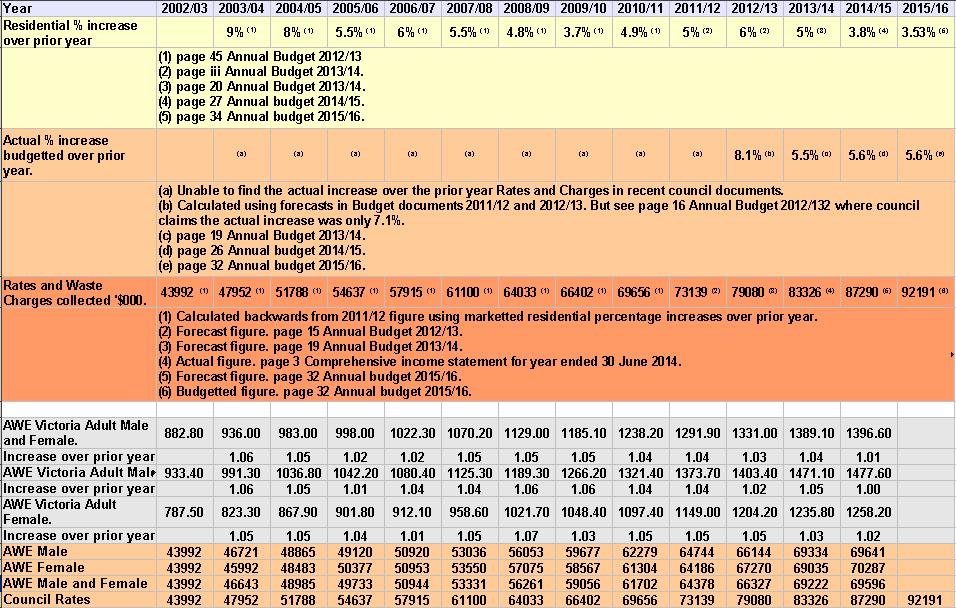
For this calculation, I used the residential rate increase to calculate backwards from 2011/12 back to 2002/2003. This is the smaller number and is less than the actual total rate increase. This means that in the table and graph I will provide shortly, Manningham council's rate increases are the smallest possible. But even using this smaller number, you will see that council rate increases are completely outrageous and exorbitant. I calculated the rate increases as follows. I was able to obtain the percentage increase each year going back to 2002/2003. Using this percentage it is easy to calculate the actual rate revenue each year for Manningham council. For instance, if the rates increase by 5%, then divide the total rates by 1.05 to see the amount of rates collected in the prior year. Then simply repeat this for each year.
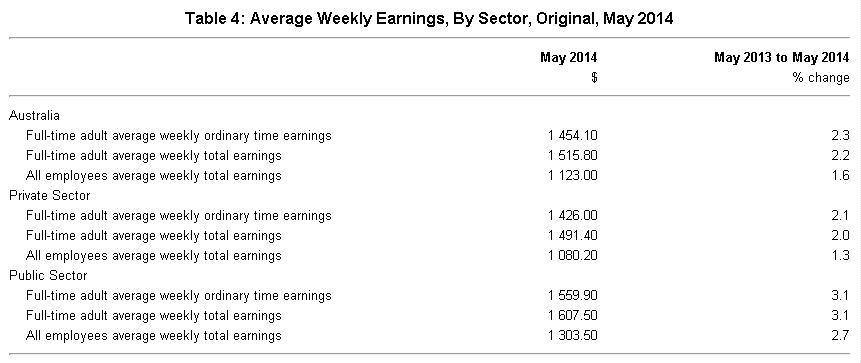
The next thing is to obtain the increase in Average Weekly Earnings for the same period of time. We can go directly to the ABS. See Here. If you want to check my figures, download table 13B. 'Average Weekly Earnings, Victoria (Dollars) – Original'. Select the 'Data' sheet tab. There you will see the Average weekly earnings for different groups of people in Victoria. I chose these three columns: a) Males full time adults, ordinary time. b) Females full time adults, ordinary time. c) Persons full time adults ordinary time. I chose ordinary time because it excludes overtime, etc. because overtime is often a matter of choice, opportunity and individual needs. Note that the ABS provides two figures for Average Weekly Earnings each year. There is a value given for both May and November each year. I chose the November figure however I am sure the May figures would give very similar results.
So lets calculate the total rates the council collects each year back to 2002/2003. And then from 2002/2003 let's apply the increase in Average Weekly Earnings to see how the two compare. To make sure there is no bias, I graphed the increase in Average Weekly Earnings for adult male, female and combined ordinary hours.
First the table with all the numbers in it. If it is a bit hard to read, please download a higher resolution image. Please don't get put off by this table. It has a lot of numbers and foot notes. Essentially it shows the total rates received by the council going back to 2002/2003. Then it shows the Average Weekly Earnings for the same period of time. It is used to plot the graph that is below the table. If you would like to check my numbers here they are:
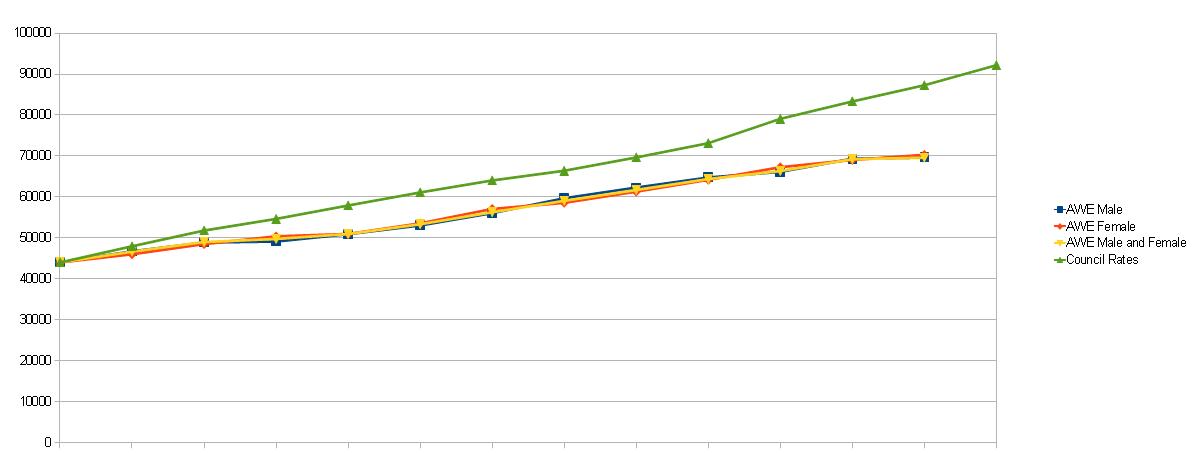
Next is the graph that was plotted using the numbers in the above table. The green line shows the growth in council rates. The other lines are the growth in average weekly earnings for Male, Female and Combined since 2002/2003. Notice how the growth in council rates consistently outstrips the growth in people's pay.
The growth in council rates from 2002/2003 has always, year by year, out-striped the growth in Average Weekly Earnings so that by 2014/2015, council rates is some 25.4% more than the growth in wages. If council rates had actually matched growth in Average Weekly Earnings they would be some 79.9% of what they are now. So take roughly 80% of your current rates bill and that is what you should be paying if council rates increased with your wages. Also please bear in mind the game that Manningham council is playing with residents. They keep residential rates low by making non-residential properties pay a much larger proportion of the rates. That green line in the graph should actually be much steeper than it is. The increase in total council rates would produce a line much steeper than the green line in the above graph. You can see I am being very conservative when it comes to the council's out of control greed. And even though I use the lowest increases in council rates, you can see that the growth in council rates is still completely over the top and unjustifiable. This two-tier rate system, that Manningham council tries to hide from people, also highlights the fact that the council stubbornly refuses to manage properly and keep their costs under control and over time, manage costs down. Instead they keep increasing residential rates by unreasonable amounts and then resort to a deceptive two-tier rate structure in an attempt to hide an even greater increase in rates from the residents and hope on one will notice what is actually going on.
From the graph, we see there is a consistent trend by Manningham council to increase rates over and above the growth in wages. If Manningham council use Average Weekly Earnings to justify increases in council rates and salaries, then we see that NOT ONCE since 2002/2003 has Manningham council taken steps to bring increases in rates and salaries back in line with increases in actual Average Weekly Earnings. The growth in Manningham council rates is simply over the top and out of control. Over the next 12 years, the discrepancy between wage growth and council rates will only get larger and larger -- as long as the council persists in their reckless waste, greed and inefficiency. There is small wonder that a growing number of residents in Manningham are finding it harder and harder to pay their rate bills on time. This is a topic that I address in detail in another article elsewhere on this web site. MANNINGHAM RESIDENTS FIND IT HARDER TO PAY THEIR RATES ON TIME. Figures from the council's own documents show more and more residents are finding it harder to pay the growing council rates. From the above data we can see why this is the case. If the council persists in their irresponsible ways, this number will only grow. Manningham council does provide some rate relief, but it is such a small amount and has so many restrictive conditions attached to it, that it provides little or no real relief from this out of control growth in council rates.
MANNINGHAM COUNCIL'S COST INCREASES ARE HIGHLY QUESTIONABLE. I mentioned above that the figures Manningham council gives for increases in their costs are highly questionable. May I give you even more reasons why this is the case.
a) Councils allow for the cost of waste, inefficiency and incompetence in their budgets In a prior article ("Manningham Council has a new number to play with") I looked at the 'Local Government Cost Index' released by the Municipal Association of Victoria (MAV). The MAV pointed out that for 2011/2012 the 'Average Construction Price Index' increased by 2.8%. However, if you look at the ABS figures for 'Output of Construction Industries' you will see that, for everyone else in Victoria, this same cost actually DECREASED by 1.0% for the same year. Please note that these are actual measured figures and not budgeted amounts or estimates. They are what actually happened. So we find that councils in Victoria paid 3.8% more (that is 2.8% + 1.0%) for construction projects in 2011/12 than did the rest of us in Victoria. How on earth can this happen? How can costs decrease for you and me but balloon for the councils? The only thing I can think of, is the utter waste, incompetence, self interest and mismanagement of resources by local councils. As I have said before, councils have little or no ability to manage costs, contractors or suppliers like the rest of us do. Also it seems they have little, if any, incentive to do so. And councils cannot use an excuse like 'timing', that is, where a council contractually agrees to a fixed price before-hand and miss out on falling prices in the future. Many private individuals and businesses would also contractually agrees to prices beforehand just as councils did. We see that when Manningham Council (and other councils) publish an increase in cost, it is not a real increase in cost like it is for you or me. It is a increase in cost that includes the cost of their mismanagement of staff, contractors, suppliers and projects.
b) Possibly half of the councils cost increase accounts for their waste and incompetence. Let me give you another example. Between 2012 and 2015 the cost of construction has been increasing below 2% for Victoria according to the ABS. However Manningham council forecasts an increase in this same cost of 4% for 2015/16. That 4% includes a tremendous amount of mismanagement and waste. Based on this number alone, we could say that when it comes to construction -- which is a significant proportion of council expenditure -- around half of the increase in cost for Manningham Council is simply due to council mismanagement, indifference, incompetence and waste.
In my view, this is why the cost figures given in council budget documents demonstrate the utter sloth, incompetence and lack of management skills by local council. There is an entirely different set of figures applicable to the rest of Australia for people who have to actually earn their money.
| ||
| Views: 1154 | Added by: Blogger | ||